Dark Mode

Dragino Sensor Temperature/Humidity Collection
Data Science and Analytics
Tags and Keywords
Trusted By


"No reviews yet"
Free
About
Data collected using Internet of Things (IoT) sensors deployed across 'The People Network' (also known as the Helium Network). This specific collection, named IoT-Town, leverages Dragino Temperature and Humidity sensors and Dragino Door-Status sensors to gather environmental readings. The data is processed using a decoder function and stored through a Google Sheet integration for streamlined access. This resource is designed for Data Scientists and students, providing a foundation to analyze real-world sensor outputs and extract valuable, previously unrealized information from decentralized network activity.
Columns
The dataset captures detailed information relating to both the sensor readings and the network transmission metrics:
- Timestamp: The precise time the specific sensor was triggered and the data packet was transferred.
- Device: Identifies the IoT device responsible for initiating the data transfer.
- Relative Humidity: The recorded percentage of relative humidity.
- Temperature - SHT (C°): The temperature measured in Celsius using the SHT sensor.
- Temperature - DS (C°): The temperature measured in Celsius using the DS sensor.
- Temperature - SHT (F°): An attempted conversion of the SHT Celsius value into Fahrenheit.
- Temperature - DS (F°): An attempted conversion of the DS Celsius value into Fahrenheit.
- Hotspot Name: The name of the Helium Hotspot that provided network coverage for the data packet transfer.
- Hotspot Latitude/Longitude: Geographic coordinates of the providing Helium Hotspot.
- RSSI (rx signal strength indicator): The Receiving Signal Strength Indicator metric.
- SNR (signal noise ratio): The Signal Noise Ratio metric.
- Battery: The battery value of the device, which remained consistent throughout the collection period.
Distribution
The raw data is generally structured for user-friendly analysis through serialisation into a Google Sheet integration. The collection phase covered a short time frame, running from 29 March 2022 to 24 April 2022. The total number of values is approximately 152 records. It is important to note that the temperature and humidity data exhibited sporadic readings and contained a handful of outliers, which may pose initial challenges for analysis. Backup collection methods, utilizing integrations like Datacake and Cayenne, confirmed the accuracy of the data transmission before relying solely on the Google Sheet integration.
Usage
This dataset is suited for several analytical and educational purposes, including:
- Performing detailed Exploratory Data Analysis (EDA) on environmental measurements.
- Practicing Data Cleaning techniques, specifically addressing noise and outliers present in real-world sensor data.
- Creating Data Visualisation projects demonstrating changes in weather and climate metrics over time.
- Analyzing the performance and reach of the decentralised 'People Network' through RSSI and Hotspot metrics.
- Developing curricula or exercises for students studying IoT data pipelines.
Coverage
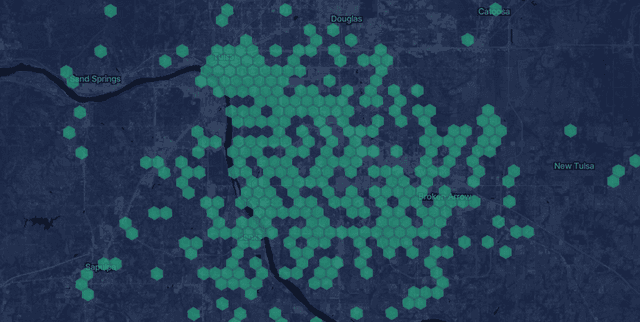
The data spans nearly a month, from 29 March 2022 to 24 April 2022. It tracks measurements from four dedicated IoT sensors (two temperature/humidity and two door-status units). Geographic scope relates to the specific location where the sensors and the transmitting Helium Hotspot (e.g., 'short-pebble-peacock') were situated. The collection is entirely focused on machine-generated environmental readings.
License
CC BY-NC-SA 4.0
Who Can Use It
- University Students: Utilising the resource for learning data cleaning and handling real-world, imperfect sensor inputs.
- Data Analysts: For statistical analysis of micro-climate variables and identifying patterns in small-scale environmental changes.
- IoT Developers: Studying the efficacy and data quality resulting from using the Helium network for device telemetry.
- Research Scientists: Investigating methods for analyzing noisy, sporadic environmental time-series data.
Dataset Name Suggestions
- IoT-Town Sensor Readings (2022)
- Decentralised Environmental Data from Helium Network
- Dragino Sensor Temperature/Humidity Collection
- Sporadic IoT Weather Data Archive
Attributes
Original Data Source: Dragino Sensor Temperature/Humidity Collection
Loading...