Dark Mode

Urban Pollution and Climate Records for Chicago
Data Science and Analytics
Tags and Keywords
Trusted By


"No reviews yet"
Free
About
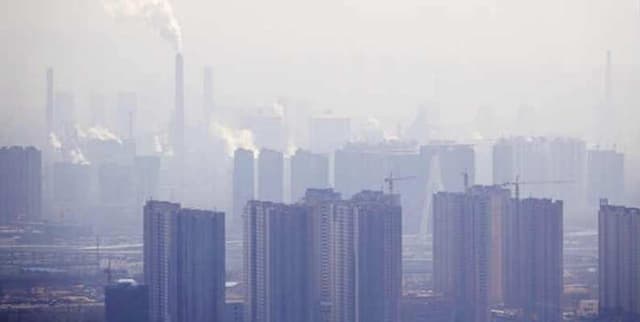
This data product focuses on air quality and related meteorological measurements recorded in Chicago over nearly two decades. The dataset explores how the city's environment has changed since regulations, such as the establishment of the Department of Air Pollution Control in 1959 and the federal Clean Air Act of 1970, helped mitigate city-wide emissions. Pollutants often tracked include fine particulate matter (PM2.5 and PM10) and ozone, which are key criteria pollutants used by agencies like the US Environmental Protection Agency (EPA) to calculate the Air Quality Index (AQI). Examining this data helps users understand long-term environmental trends and the efficacy of public health regulations.
Columns
- index: An unidentified numerical index field, ranging from 0.00 up to 6939.00.
- city: Identifies the location of the readings, recorded only for Chicago.
- tmpd: Temperature readings, spanning a wide range from -16 to 92.
- dptp: Related environmental measurement, ranging from -25.6 to 78.3.
- date: The date when the reading was recorded, used to track temporal trends.
- pm25tmean2: Readings for fine particulate matter measuring 2.5 microns or less in diameter.
- pm10tmean2: Readings for fine particulate matter.
- o3tmean2: Ozone reading, with values observed between 0.15 and 66.6.
- no2tmean2: Nitrogen dioxide (NO2) reading, spanning 6.16 to 62.5.
Distribution
The dataset is presented in a tabular format, specifically named
chicago_air_pollution.csv, with a file size of 445.87 kB. It contains 9 columns. The data includes 6940 total records, indicating 100% validity for fields like index, city, date, o3tmean2, and no2tmean2. However, fields related to fine particulate matter have varying levels of completeness; for example, pm25tmean2 has a significant proportion of missing data (64%). The usability score assigned to this data product is 10.00, and there is no expectation for future updates.Usage
This data product is ideally suited for:
- Educational Purposes: Utilizing the records to learn and practise Exploratory Data Analysis (EDA) techniques.
- Environmental Monitoring: Analyzing changes in key pollutant levels (e.g., PM2.5, Ozone) over the span of nearly two decades.
- Regulatory Impact Assessment: Studying long-term urban air quality improvements following local and federal legislation designed to control emissions.
Coverage
The data covers the geographical area of Chicago, Illinois, USA. The temporal scope spans from 1 January 1987 to 31 December 2005. The readings include concentrations for pollutants that significantly influence the overall Air Quality Index (AQI), particularly Fine Particulate Matter (PM2.5) and ozone, which are heavily weighted due to their harm and common high prevalence. For context, the US EPA recommends annual PM2.5 exposure not exceed 12 µg/m3, while the World Health Organization (WHO) employs a stricter annual standard of 10 µg/m3.
License
CC0: Public Domain
Who Can Use It
- Data Science Students and Instructors: To perform case studies in environmental data processing, cleaning, and visualisation using real-world data containing missing values.
- Public Health Researchers: To correlate historical pollution levels with potential health outcomes, especially concerning vulnerable populations like children, the elderly, or those with existing cardiovascular or respiratory issues.
- Environmental Policy Analysts: To track the long-term effectiveness of air quality interventions implemented since the 1970s.
Dataset Name Suggestions
- Chicago Historical Air Quality Measurements (1987-2005)
- Urban Pollution and Climate Records for Chicago
- Air Quality Index Pollutant Readings: Chicago
Attributes
Original Data Source: Urban Pollution and Climate Records for Chicago
Loading...