Dark Mode

London Tube Traffic and Geospatial Data
Data Science and Analytics
Tags and Keywords
Trusted By


"No reviews yet"
Free
About
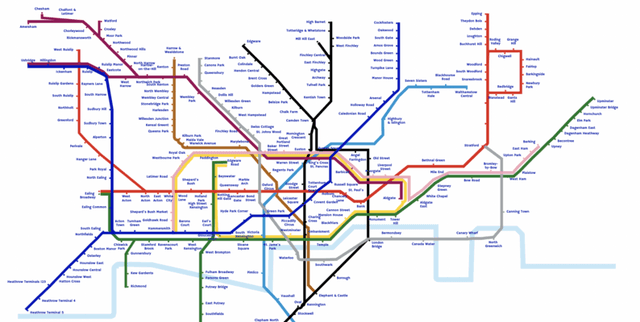
Provides detailed statistics on station entries and exits for the London Underground system, spanning the years 2007 through 2017. The core focus is on recording annual station usage totals, derived from typical daily counts categorized by day of the week (weekday, Saturday, and Sunday). Additionally, the product includes a separate JSON file containing geospatial information, such as coordinates for tube stations, railway lines, and the River Thames, which is highly valuable for map creation and visualization projects based on the classic London tube map design.
Columns
- nlc: The unique identifier assigned to the station.
- Station Name: The official name of the London Underground station.
- Borough: The surrounding administrative area where the station is located.
- Note: Indicator for specific counting issues or adjustments during the year (e.g., N=station closed, T=figures include W&C line passengers, A=previous year's counts adjusted).
- Entry_Week: The typical total number of entries recorded on a weekday.
- Entry_Saturday: The typical total number of entries recorded on a Saturday.
- Entry_Sunday: The typical total number of entries recorded on a Sunday.
- Exit_Week: The typical total number of exits recorded on a weekday.
- Exit_Saturday: The typical total number of exits recorded on a Saturday.
- Exit_Sunday: The typical total number of exits recorded on a Sunday.
- AnnualEntryExit_Mill: The estimated total sum of entries and exits for the entire year, expressed in millions.
Distribution
The core station usage figures are distributed in a tabular format, typically CSV, with 10 columns and 273 records detailing usage for London Underground stations. A supplementary JSON file provides geospatial data, including station latitude/longitude coordinates and line segment coordinates. Daily entry and exit counts are provided, which must be scaled up to annual figures using a weighting system: weekdays are weighted by 253, Saturdays by 52, and Sundays by 59. This calculation accounts for a 364-day year, excluding Christmas Day.
Usage
This information is ideal for traffic analysis and modelling, allowing users to understand how passenger flow fluctuates across different days of the week. It is valuable for urban planning and infrastructure development projects in London. It can be used extensively for data visualisation, particularly for creating accurate, web-based renderings of the London Underground system map and comparing station usage across different years.
Coverage
The data covers all relevant stations within the London Underground system. The temporal scope ranges from 2007 up to, and including, 2017. The figures represent total entries and exits, providing a broad overview of general passenger behaviour and usage volume. The methodology for calculating annual figures assumes that seven Bank Holidays are represented by seven Sundays.
License
Attribution 4.0 International (CC BY 4.0)
Who Can Use It
- Transportation Analysts: For studying historical trends in London transit demand and evaluating system efficiency.
- Urban Planners: For assessing the impact of population density or new developments on specific underground stations.
- Data Visualization Specialists: For building interactive maps and visual representations of the tube network and passenger density.
- Students/Researchers: For academic study focused on European transportation networks and urban mobility patterns.
Dataset Name Suggestions
- London Underground Passenger Flow Statistics
- TFL Annual Station Usage Data (2007-2017)
- London Tube Traffic and Geospatial Data
- UK Rail Transport Usage
Attributes
Original Data Source: London Tube Traffic and Geospatial Data
Loading...