Dark Mode

Worldwide SO2 Emissions and Aviation Safety Data
Data Science and Analytics
Tags and Keywords
Trusted By


"No reviews yet"
Free
About
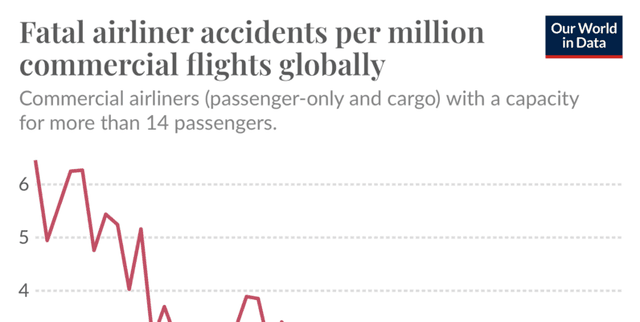
Tracking the decline in fatal commercial flight occurrences and documenting significant shifts in global sulfur dioxide (SO2) emissions from the shipping industry. This collection details the improving safety record of commercial aviation worldwide over five decades, illustrating a steep reduction in fatal accident rates per million flights. Additionally, it incorporates recent, dramatic changes in maritime SO2 emissions following strict international regulatory limits imposed in 2020, offering insight into pollution control impacts.
Columns
- Entity: The geographic scope of the measurement, specifically defined as 'World'.
- Code: The unique identifier associated with the geographic entity, typically 'OWID_WRL'.
- Year: The time point for the measured statistic, capturing data across the entire range.
- Fatal accidents per million commercial flights: The primary metric detailing aviation safety performance over time.
Distribution
The information is available in a structured data file format, such as CSV. The dataset contains 50 valid records, with 4 distinct columns structured for analysis. Specific numbers for rows or records beyond this sample set are not detailed, but the file size is very small, approximately 1.64 kB. The data is expected to be updated annually.
Usage
This product is highly suitable for safety analysis, long-term trend visualisation concerning aviation risk, environmental policy evaluation, and modeling the effects of maritime regulation compliance. It is ideal for researchers studying global transport safety metrics and those interested in understanding atmospheric chemistry changes resulting from pollution control efforts. For instance, in the 1970s, approximately six fatal airliner accidents occurred for every million commercial flights, but recent data shows this figure has dropped significantly to about half a fatality per million flights, providing strong longitudinal comparison points. The striking drop in SO2 emissions from shipping—falling from over 10 million tonnes annually in 2019 to 3 million tonnes a year later—offers key data for environmental impact studies.
Coverage
The geographic scope is worldwide, focusing on global aggregated trends. The temporal range for the aviation safety metrics extends from 1970 through to 2020. The context includes references to SO2 emission changes that specifically span the period from 2019 to 2022, driven by international maritime regulatory changes introduced in 2020.
License
CC0: Public Domain
Who Can Use It
- Aviation safety analysts seeking longitudinal data on fatality rates and risk reduction.
- Environmental scientists modeling global air quality and climate change implications, particularly the masking effects of SO2.
- Policy makers assessing the efficacy of international shipping and transport regulations.
- Data journalists and researchers reporting on trends in global transport safety and environmental sustainability.
Dataset Name Suggestions
- Global Commercial Flight Safety & Shipping Emissions Trends
- Decline in Fatal Airliner Accidents (1970-2020)
- Worldwide SO2 Emissions and Aviation Safety Data
- Maritime Emission Regulation Impact Data
Attributes
Original Data Source: Worldwide SO2 Emissions and Aviation Safety Data
Loading...