Dark Mode

The Dress Viral Perception Survey
Product Reviews & Feedback
Tags and Keywords
Trusted By


"No reviews yet"
Free
About
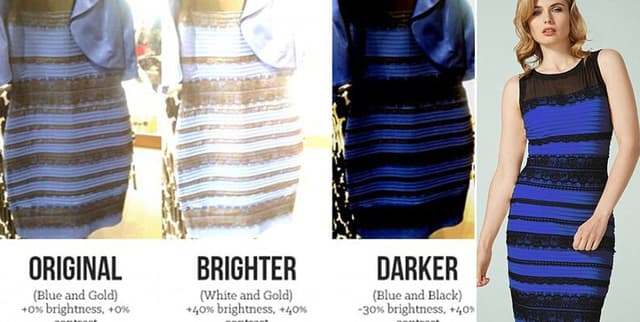
This collection of survey responses documents the global viral phenomenon known as #TheDress, focusing on the visual ambiguity of whether the garment appeared White & Gold or Blue & Black. The data captures the perceptions of over 1000 contributors. A primary objective of the survey was to investigate a hypothesis linking an individual's chronotype (such as 'Night Owls' or 'Morning People') to differences in how they perceived the dress's colours, offering material for psychological and popular culture research.
Columns
The dataset contains 17 columns, with 10 key fields detailed below:
- _unit_id: A unique reference code assigned to each survey response.
- _created_at: The date and time when the survey submission was finalised.
- _id: A unique identifier provided for each response.
- _started_at: The date and time the participant began the survey process.
- _tainted: A boolean value indicating whether the response was flagged as suspicious (all records are marked as false).
- _channel: Specifies the platform or route through which the survey was accessed, such as 'neodev' or 'clixsense'.
- _trust: A metric (between 0 and 1) representing the estimated trustworthiness of the survey response.
- _worker_id: A unique identifier assigned to the individual worker who completed the survey.
- _country: Identifies the country where the worker was located, with high variation (82 unique countries).
- _region: Identifies the region where the worker was located, though some values are missing.
Distribution
The data file, typically supplied in CSV format, is named
Hashtag-That-Dress-DFE.csv and is approximately 201.36 kB in size. It includes 1015 validated records, representing the total number of usable survey responses. The data is structured with 17 total columns dedicated to perception feedback and worker metadata.Usage
This resource is ideally suited for academic and professional applications, including:
- Psychological Studies: Research into visual perception, colour bias, and potential links between chronotypes and sensory interpretation.
- Social and Cultural Analysis: Tracking and understanding the rapid spread and impact of viral internet phenomena.
- Data Quality Assessment: Analysing fields like
_trust,_channel, and geolocation data for crowd-sourced survey reliability studies.
Coverage
The survey was conducted over a short, intensive period in late February 2015, capturing the initial height of the viral event. Geographically, the participants are diverse, originating from 82 unique countries, with Venezuela (VEN) and Spain (ESP) being frequently represented. The dataset’s scope centres on quantifying perception and correlating this visual output with auxiliary user metadata.
License
CC0: Public Domain
Who Can Use It
- Psychologists and Neuroscientists: To study subjective visual experience and factors influencing perception.
- Market Researchers: To analyse how controversial or ambiguous visual stimuli generate widespread social media engagement.
- Students and Educators: For projects in introductory statistics, data cleaning, and popular culture studies.
Dataset Name Suggestions
- The Dress Viral Perception Survey
- Blue & Black vs White & Gold Study
- The Iconic Dress Colour Controversy Data
- Hashtag-That-Dress Survey Results
Attributes
Original Data Source: The Dress Viral Perception Survey
Loading...