Dark Mode

Historical Century of Price Indices
Government & Civic Records
Tags and Keywords
Trusted By


"No reviews yet"
Free
About
The data elucidates the US Consumer Price Index for All Urban Consumers (CPI-U), serving as the standard and longest-running monthly indicator of inflation in the United States. It constitutes a monthly time series documenting U.S. city averages for all items, establishing a valuable historical record dating back over a century. The index is normalised using the base period 1982–84 set to equal 100. This is the most accepted price index and provides the most extensive set of historical data for economic analysis.
Columns
- Date: Records the date of the monthly entry, expressed as a DateTime count. The records span from 1 January 1913 to 1 January 2014.
- Index: Represents the actual CPI-U value for the corresponding month. These values are highly stable, with 100% validity across all records, ranging from a minimum of 9.7 to a maximum of 234.
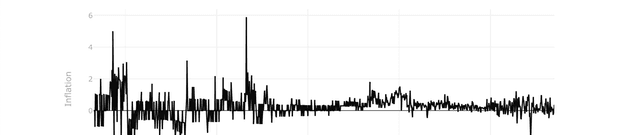
- Inflation: Measures the rate of inflation. This column includes one missing value and has values that fluctuate between -3.16 and 5.88. The mean inflation rate observed is 0.26, with a standard deviation of 0.66.
Distribution
The data is delivered in a standard CSV file format named
cpiai_csv.csv, with a file size of 27.03 kB. The structure consists of 3 distinct columns. There are 1,213 valid records for the Date and Index fields. The Inflation field contains 1,212 valid records.Usage
This data set is ideally suited for macroeconomic modelling, tracking long-term trends in consumer purchasing power, and performing historical time-series analysis on price movements. It is essential for researchers needing to adjust historical financial metrics or wages for inflation, providing the foundational measure for cost-of-living adjustments across the 20th and early 21st centuries.
Coverage
The geographic scope covers U.S. city averages. The time range provides monthly data spanning slightly over 100 years, from January 1913 to January 2014. The data specifically tracks the Consumer Price Index for All Urban Consumers (CPI-U).
License
CC0: Public Domain
Who Can Use It
- Economists: For rigorous analysis of economic cycles and price stability since the start of the 20th century.
- Historians: To correlate consumer costs with major historical events like wars or economic depressions.
- Financial Professionals: For back-testing investment strategies and adjusting asset valuations to reflect real (inflation-adjusted) returns.
Dataset Name Suggestions
- US Consumer Price Index History (1913-2014)
- Monthly US CPI-U and Inflation Rates
- Historical Century of Price Indices
Attributes
Original Data Source: Historical Century of Price Indices
Loading...