Dark Mode

UNICEF 40 Years of Immunization Data
Public Safety & Security
Tags and Keywords
Trusted By


"No reviews yet"
Free
About
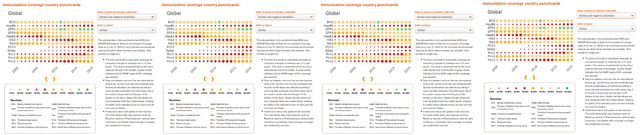
Data covering global childhood immunization provides essential statistics detailing vaccination coverage across four decades. Sourced from the UNICEF Data Warehouse, the information spans 1980 up to 2019. It offers a crucial tool for public health researchers, featuring a broader selection of vaccine types/doses and nations compared to several datasets derived from the Global Health Observatory data repository of WHO. The primary significance of this dataset is its utility in correlating rates of immunization with potential impacts on the spread of diseases, such as CoViD.
Columns
The dataset consists of 17 distinct columns. Key metrics and identifiers include:
- Geographic area: Identifies the Country/Region, featuring 214 unique geographic entities.
- Indicator: Describes the metric being measured, typically the Percentage of surviving infants by Vaccine Type and Dose (e.g., the percentage who received the third dose of inactivated polio-containing vaccine).
- Vaccine: Details the specific Type and Dose of Vaccine, with 14 unique types listed, such as Polio third dose or Diphtheria, tetanus, and pertussis first dose.
- Current age: Specifies the Age of Children at Vaccination, with the most common age group being 12 to 23 months old.
- TIME_PERIOD: The year the observation was recorded, ranging from 1980 to 2019.
- OBS_VALUE: The Observed value, representing the percentage coverage. Values range from 1 to 99, with a mean of 80.4.
- Unit of measure: Consistent unit of measure used across the observations (%).
- Observation Status: Indicates the nature of the observation (e.g., Estimated value).
- DATA_SOURCE: The specific origin of the estimates, listed as "WHO/UNICEF estimates of national immunization coverage, 2019 revision."
Distribution
This dataset is delivered as a single CSV file, named
fusion_IMMUNISATION_UNICEF_1.0_all.csv, with a file size of 15.84 MB. It contains 58.3k valid records across all 17 columns. The data exhibits high integrity, showing zero missing or mismatched values across the main observational and demographic columns.Usage
The data can be utilised in a multitude of ways for exploration and gaining insights. A primary application is the potential study of correlations between historical immunization rates and the subsequent spread of illnesses like CoViD. Additionally, it is useful for time series analysis of vaccine uptake and geographic comparisons of public health policy impact.
Coverage
The data spans a substantial period, covering the years 1980 up to 2019. Geographically, it includes records from 214 countries and regions globally. The scope focuses specifically on childhood immunization, reporting on 14 different vaccine types and doses administered to surviving infants, primarily those aged 12 to 23 months old.
License
CC0: Public Domain
Who Can Use It
- Public Health Researchers: To perform historical analyses of vaccine coverage trends and disparities between nations.
- Data Scientists/Analysts: To explore correlations, such as linking long-term immunization levels to pandemic statistics.
- Government and Non-Governmental Organisations: To monitor progress in meeting immunization targets and inform future health strategies.
Dataset Name Suggestions
- Global Childhood Vaccine Coverage Rates (1980–2019)
- UNICEF 40 Years of Immunization Data
- Worldwide Infant Vaccination Statistics
Attributes
Original Data Source: UNICEF 40 Years of Immunization Data
Loading...