Brazilian Highway Accident Records
Public Safety & Security
Tags and Keywords
Trusted By


"No reviews yet"
Free
About
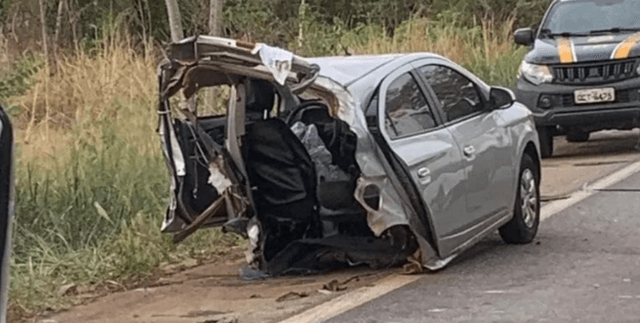
This dataset captures details of car accidents in Brazil over a seven-year period, from 2017 to 2023. It contains 400,000 records, offering insights into various aspects of traffic incidents. The data includes information on the date and time of accidents, their locations (state, city, road ID, kilometre), causes, and types of collisions. It also provides details on the number of people involved, the condition of victims (injured, dead, safe), environmental factors like weather and road conditions, and police involvement. This resource is valuable for understanding accident patterns and informing road safety initiatives.
Columns
- inverse_data: The date when the accidents occurred (yyyy-mm-dd format).
- week_day: The day of the week (e.g., Saturday, Sunday). Saturday and Sunday are the most frequent days, each accounting for 17% of accidents.
- hour of the accident: The specific hour, minute, and second of the accident (hh:mm:ss format).
- state: Acronyms for Brazilian states where accidents happened. Minas Gerais (MG) and Santa Catarina (SC) are the most common states, with 13% and 12% respectively.
- road_id: Identifiers for roads, similar to state routes. Roads '101' and '116' are the most frequently recorded, making up 17% and 15% of incidents.
- km: The exact kilometre marker on the road where the accident took place.
- city: The name of the city where the accident occurred. Brasilia and Curitiba each represent 1% of the accident records.
- cause_of_accident: The primary reason for the accident. "Driver's lack of attention to conveyance" is the leading cause at 23%, followed by "Incompatible velocity" at 9%.
- type_of_accident: Describes what happened to the vehicle(s) involved. "Rear-end collision" is the most common type (19%), with "Run-off-road" being the second most common (16%).
- victims_condition: Indicates the status of victims as injured, dead, or safe. Accidents "With injured victims" account for 72% of records.
- weather_timestamp: Indicates whether the accident occurred during the "Day" (55%) or "Night" (35%).
- road_direction: Specifies the direction of the road as "Increasing" (53%) or "Decreasing" (47%).
- wheather_condition: Describes the weather at the time of the accident. "Clear sky" is present in 58% of cases, while "Cloudy" conditions account for 17%.
- road_type: Characterises the road as "Simple" (51%) or "Double" (41%).
- road_delineation: Describes the road's shape at the accident site. "Straight" roads are involved in 60% of accidents, and "Curve" in 16%.
- people: The number of people involved in an accident. The mean is 2.36, ranging from 1 to 80 individuals.
- deaths: The number of fatalities. The mean is 0.08, with a maximum of 21 deaths in a single incident.
- slightly_injured: The number of slightly injured individuals. The mean is 0.84, with a maximum of 61.
- severely_injured: The number of severely injured individuals. The mean is 0.26, with a maximum of 31.
- uninjured: The number of uninjured individuals. The mean is 1.04, with a maximum of 73.
- ignored: The number of individuals whose injury status was categorised as ignored. The mean is 0.14, with a maximum of 54.
- total_injured: The total number of injured individuals. The mean is 1.09, with a maximum of 66.
- vehicles_involved: The number of vehicles involved in an accident. The mean is 1.65, ranging from 1 to 23 vehicles.
- latitude: The geographical latitude coordinate of the accident.
- longitude: The geographical longitude coordinate of the accident.
- regional: The regional police unit involved. SPRF-MG (13%) and SPRF-SC (12%) are the most common.
- police_station: The specific police station recorded for the incident. DEL01-PR (5%) is the most common.
Distribution
The dataset is provided in a tabular format, likely a CSV file (
accidents_2017_to_2023_english.csv). It consists of 400,000 records across 27 columns. The file size is 133.26 MB. The dataset is expected to be updated annually.Usage
This dataset is well-suited for:
- Traffic safety analysis: Identifying high-risk areas, common accident causes, and types of collisions.
- Policy formulation: Informing decisions on road infrastructure improvements, traffic regulations, and public awareness campaigns.
- Data visualisation: Creating visual representations of accident trends, geographical hotspots, and impact factors.
- Predictive modelling: Developing models to forecast accident likelihood based on various conditions.
- Educational purposes: Serving as a practical example for data analysis and statistical studies for beginners.
Coverage
- Geographic Scope: Brazil, covering multiple states and cities, with specific details on road identifiers and exact kilometre locations.
- Time Range: The data spans seven years, from 1st January 2017 to 31st August 2023.
- Data Availability: The dataset provides detailed counts for various categories such as days of the week, states, roads, cities, accident causes and types, victim conditions, weather, road characteristics, and counts of people and vehicles involved.
License
CC0: Public Domain
Who Can Use It
- Researchers and Academics: For studying patterns of road accidents, their causes, and impacts.
- Government Agencies (e.g., Transport Departments, Police): For strategic planning, resource allocation, and implementing road safety measures.
- Urban Planners: To identify dangerous road segments and design safer urban environments.
- Data Scientists and Analysts: For practising data cleaning, analysis, and machine learning techniques on real-world data.
- Journalists: For reporting on traffic safety issues and trends in Brazil.
Dataset Name Suggestions
- Brazilian Road Incident Data (2017-2023)
- Brazil Traffic Accidents Chronicle
- National Road Safety Dataset - Brazil
- Brazilian Highway Accident Records
Attributes
Original Data Source: Brazilian Highway Accident Records
Loading...
