Dark Mode

London Public Transport Crime Rates
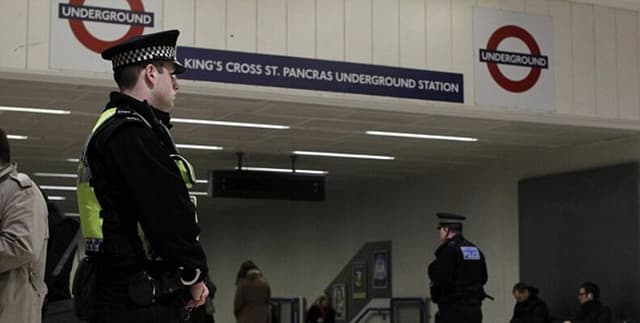
Public Safety & Security
Tags and Keywords
Trusted By


"No reviews yet"
Free
About
Presents statistics on crime rates across various modes of transport within the city of London. The data consists of crime incident counts and the corresponding rates calculated per million passenger journeys, providing a crucial resource for safety analysis and urban planning. This data has been sourced from the TFL Open Datastore and subsequently processed into a more user-friendly format, with expected annual updates.
Columns
The dataset contains 14 columns tracking monthly trends across fiscal years:
- Month: The specific month the incident data corresponds to (12 unique values).
- rate-XX-XX (e.g., rate-12-13, rate-21-22): Columns representing the crime rate for specific fiscal years, such as 2012-2013 through to 2021-2022.
Distribution
This is a tabular dataset primarily available in CSV format, specifically the
all_transport_rate.csv file, which is 764 B in size. The structure typically includes 12 total values (records) per fiscal year column for monthly analysis. While detailed row counts are not provided, the yearly update frequency ensures current data availability. A separate metadata.csv file provides details on sourcing and collection methods.Usage
This data is ideally suited for academic research into public safety, statistical modeling of urban crime trends, and governmental analysis of transport security initiatives. It can be used to compare safety metrics between different transport types and to track long-term trends in passenger security within the capital.
Coverage
The geographic focus is strictly the London transport system. The temporal scope includes crime rate measurements spanning from the 2009-2010 fiscal year up to the 2021-2022 fiscal year. It is important to note that Underground volume and rate numbers incorporate Docklands Light Railway (DLR) statistics up to March 2017. Data for the earliest reported years (2009-2012) may be substantially incomplete.
License
CC0: Public Domain
Who Can Use It
- Public Policy Analysts: To evaluate the impact of London transport safety campaigns.
- Urban Planners: To inform decisions regarding infrastructure development and high-risk zones.
- Journalists: For reporting on annual fluctuations in public transport safety and security.
- Academic Researchers: To conduct detailed longitudinal studies on crime rates tied to specific transport modes.
Dataset Name Suggestions
- London Public Transport Crime Rates
- TFL Annual Crime and Safety Statistics
- London Transit Security Rates by Mode
Attributes
Original Data Source: London Public Transport Crime Rates
Loading...