Dark Mode

Enriched NYTimes COVID-19 U.S. County Data
Patient Health Records & Digital Health
Tags and Keywords
Trusted By


"No reviews yet"
Free
About
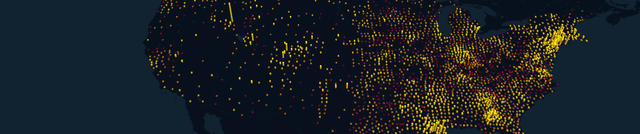
This resource provides an enriched version of the NYTimes COVID-19 U.S. county-level data, offering advanced metrics and necessary context for detailed analysis. It enhances the original statistics by integrating crucial geospatial data, calculated per-capita figures, population density estimates, and daily change metrics (new cases and deaths per day). The inclusion of county demographic breakdowns, such as age, race, and gender, allows users to gain a substantial head start in their COVID-19 related analytic, modelling, and visualization efforts aimed at understanding the virus's spread and severity across different parts of the U.S.
Columns
- date The date the COVID data was reported.
- county The official U.S. county name.
- state The official U.S. state name.
- fips The county full FIPS code, serving as a unique county identifier (equivalent to state_fips + county_fips).
- state_fips The state FIPS code.
- county_fips The county FIPS code.
- cases The total confirmed cases recorded.
- deaths The total confirmed deaths recorded.
- new_day_cases New reported confirmed cases since the previous day.
- new_day_deaths New reported confirmed deaths since the previous day.
- cases_per_capita_100k Total confirmed cases per capita multiplied by 100,000.
- deaths_per_capita_100k Total confirmed deaths per capita multiplied by 100,000.
- new_day_cases_per_capita_100k Confirmed new day cases per capita multiplied by 100,000.
- new_day_deaths_per_capita_100k Confirmed new day deaths per capita multiplied by 100,000.
- county_pop_2019_est 2019 census county population estimates.
- pop_per_sq_mile_2010 2010 census county population density estimates (populate per square mile).
Distribution
The data is available in CSV format, specifically the file
covid19_us_county.csv. This resource contains 16 distinct columns and approximately 231,000 valid records. The file size is 26.04 MB. Updates to the dataset are expected on a daily frequency.Usage
This data product is ideal for several applications, particularly focusing on geospatial analysis and visualization. Users can determine which counties are currently getting hit the hardest, both by total and per capita metrics. It facilitates simulating patterns in the spread of the virus across counties, potentially using network-based spread simulations driven by county center coordinates. It allows for the investigation of whether county population densities play a role in the speed of viral transmission and enables users to compare specific county and state case and death metrics against national trends. The FIPS code column ensures easy integration and joining with other county level datasets.
Coverage
The geographic scope includes all counties within the United States. The temporal scope spans daily records starting from 21 January 2020 through to 13 June 2020, enabling the analysis of changes over time. Demographic details per county are also included, encompassing age, race, and gender breakdowns, which can be utilised to identify regions potentially most susceptible to outbreaks. A specific geographical exception is applied to New York City data, where cases for the five boroughs (New York, Kings, Queens, Bronx and Richmond counties) are aggregated and assigned the 'New York County' FIPS code (36061) to allow for joining with geometry and accurate calculation of per capita metrics.
License
CC BY-SA 3.0
Who Can Use It
- Public Health Researchers: To analyse the influence of county demographics on viral susceptibility and outcomes.
- Data Scientists and Modellers: To build predictive models and run network-based spread simulations.
- Journalists and Visual Artists: To create informative time-lapse visualizations of confirmed cases per county (per capita) for public communication.
- Government Analysts: To benchmark responses and severity metrics across different U.S. states and counties.
Dataset Name Suggestions
- Enriched NYTimes COVID-19 U.S. County Data
- Geospatial U.S. COVID-19 County Data Atlas
- U.S. County Daily Pandemic Severity Metrics
- COVID-19 Population Density and Demographics Atlas
Attributes
Original Data Source: Enriched NYTimes COVID-19 U.S. County Data
Loading...