Dark Mode

Synthetic Supply Chain Demand Data
Synthetic Data Generation
Tags and Keywords
Trusted By


"No reviews yet"
Free
About
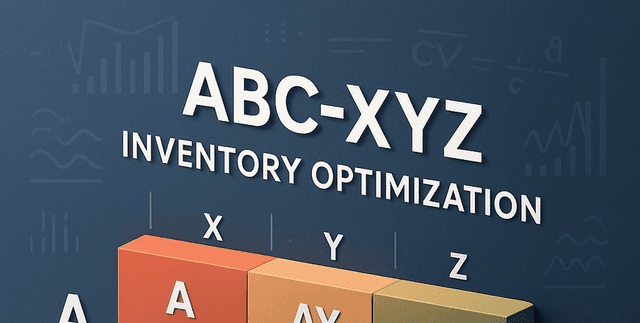
Provides synthetic monthly demand and annual sales value data engineered specifically for ABC-XYZ inventory segmentation analysis. This resource simulates real-world supply chain dynamics, offering the necessary variables to apply two fundamental inventory management techniques: value-based prioritisation (ABC) and demand stability analysis (XYZ). It is a vital tool for optimising stock levels, improving service efficiency, and reducing unnecessary holding costs through robust data-driven planning.
Columns
The data product contains 18 columns covering identification, classification, monthly demand history, and financial metrics:
- Item_ID: A unique identifier for each product, such as
ITM_001. - Item_Name: The product description (e.g., "Wireless Headphones" or "Winter Jacket").
- Category: The product grouping. There are five distinct categories included (Grocery, Electronics, Apparel, Home & Kitchen, and Toys).
- Jan_Demand through Dec_Demand: Unit sales figures recorded for each of the twelve months, showing realistic demand variability.
- Total_Annual_Units: The aggregate number of units sold over the entire year.
- Price_Per_Unit: The unit sale price in USD.
- Total_Sales_Value: The calculated annual revenue for the item (Total Annual Units multiplied by Price Per Unit).
Distribution
The data product consists of 1,000 unique records, representing 1,000 distinct items. It is structured with 18 fields of inventory and demand information. All data points are validated across all columns, ensuring zero missing or mismatched values. The underlying data patterns include features designed specifically for both ABC Classification (based on sales value) and XYZ Classification (based on demand stability).
Usage
Ideal applications for this data include:
- Practicing and testing algorithms for ABC inventory classification, focusing on high-value items.
- Performing XYZ inventory classification, analysing the consistency and volatility of product demand.
- Training predictive models for demand forecasting and stock level adjustments.
- Educational exercises for students and professionals in supply chain management and data analytics.
Coverage
The temporal scope covers 12 consecutive months of simulated operational data, running from January through December. The dataset encompasses 1,000 unique items spanning five distinct product groups: Electronics, Grocery, Apparel, Home & Kitchen, and Toys. As a synthetic inventory simulation, the data does not include specific geographic or demographic information.
License
CC0: Public Domain
Who Can Use It
- Supply Chain Professionals: For refining segmentation strategies and cost optimisation efforts.
- Data Analysts: For applying classification models and creating stock rotation groups.
- Students: For practical learning concerning core inventory management techniques.
Dataset Name Suggestions
- Inventory Management ABC-XYZ Simulator
- Synthetic Supply Chain Demand Data
- Product Classification and Sales History
- Annual Demand and Sales Value Metrics
Attributes
Original Data Source: Synthetic Supply Chain Demand Data
Loading...