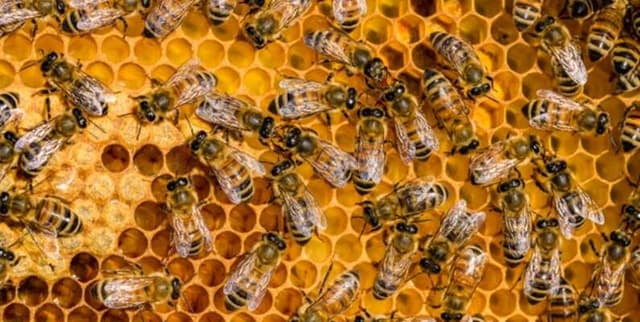
United States Bee Colony Quarterly Data
Data Science and Analytics
Tags and Keywords
Trusted By


"No reviews yet"
Free
About
An analytical view of honey bee colonies throughout the United States, spanning from 2015 to 2021. Sourced from the USDA National Agricultural Statistics Service (NASS), this data provides key metrics including colony numbers, losses, additions, renovations, and identified stressors. The information is structured quarterly for larger beekeeping operations (five or more colonies) and annually for smaller ones, enabling detailed analysis of the health and challenges facing these essential pollinators over time. This data is valuable for researchers, agricultural analysts, and policymakers monitoring pollinator well-being.
Columns
This description is based on the provided metadata and summary, as the full CSV file was not supplied. The data is expected to include the following columns and concepts:
- State: The US state where data was recorded. An "Other states" row aggregates data for states not published individually, and a total for the United States is also provided.
- Time Period: The year and quarter for operations with five or more colonies, or just the year for smaller operations.
- Number of Colonies: The count of honey bee colonies.
- Maximum Colonies: The total number of colonies within a state during a quarter, including any colonies that were moved in.
- Lost Colonies: The total count of colonies that were lost.
- Percent Lost: The percentage of colonies lost. The calculation method differs for individual states versus the national total.
- Added Colonies: The number of new colonies added.
- Renovated Colonies: Colonies that have been requeened or have received new bees.
- Percent Renovated: The percentage of colonies renovated, with calculation methods varying between state and national levels.
- Colonies Lost with CCD Symptoms: The count of lost colonies that exhibited symptoms of Colony Collapse Disorder, categorised by operation size (more or less than five colonies).
- Stressors: Data points detailing various stressors that affect honey bee colonies.
- Data Table Notes: Keys for special values are included, such as '(X)' for 'Not applicable' and '(Z)' for values less than half the unit shown.
Distribution
The dataset is available in CSV and TXT formats. A supplementary text file (
Info-NASS_Bee-Colony_2015-2021.txt) containing table information is approximately 1.47 kB. Data is collected quarterly for larger beekeeping operations and annually for smaller ones.Usage
This data is well-suited for:
- Analysing trends in honey bee colony health and decline over a seven-year period.
- Creating data visualisations to illustrate the impact of various stressors on bee populations, similar to the linked Tableau dashboard.
- Informing agricultural policy development and conservation strategies.
- Supporting academic research in fields such as biology, ecology, and agriculture.
- Developing predictive models to forecast colony loss.
Coverage
- Geographic: The dataset covers the United States, with data aggregated by state and a national total. It also contains an "Other states" category for states whose data is not published individually.
- Time Range: The data extends from the first quarter of 2015 to 2021. Updates are expected to be made annually.
- Demographic: Data is gathered from a stratified sample of beekeeping operations, distinguished by size (operations with more than five colonies and those with less than five).
License
CC0: Public Domain
Who Can Use It
- Data Analysts and Scientists: For creating models and visualisations related to agricultural trends and environmental science.
- Researchers and Academics: To investigate pollinator health, Colony Collapse Disorder, and the effects of environmental stressors.
- Government Agencies and Policymakers: To formulate evidence-based policies supporting the agricultural sector and protecting pollinators.
- Beekeeping Associations and Enthusiasts: To gain insight into wider trends impacting honey bee populations nationwide.
Dataset Name Suggestions
- US Honey Bee Colony Health & Stressors 2015-2021
- NASS Honey Bee Colony Statistics
- United States Bee Colony Quarterly Data
- Annual Survey of US Honey Bee Colonies
- Honey Bee Population and Stressor Data (2015-2021)
Attributes
Original Data Source: United States Bee Colony Quarterly Data
Loading...
Free
Download Dataset in ZIP Format
Recommended Datasets
Loading recommendations...
