Dark Mode

Standardised Interannual Climate Variability Data
Data Science and Analytics
Tags and Keywords
Trusted By


"No reviews yet"
Free
About
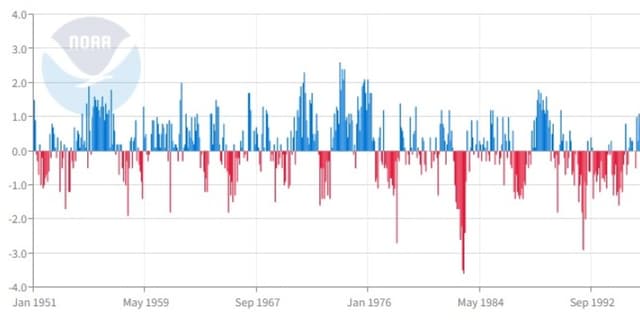
This collection features standardised monthly climate data related to the El Niño-Southern Oscillation (ENSO) phenomenon. ENSO is recognised as a primary force driving interannual climate variability worldwide, stemming from periodic fluctuations in wind and sea surface temperature over the tropical eastern Pacific Ocean. It is highly significant as its events can trigger a broad array of climate anomalies globally. This dataset provides the necessary indicators for climate scientists and researchers to analyse, model, and forecast ENSO events effectively. The data was gathered from authoritative sources, including NOAA, NCEI, and NCAR.
Columns
The dataset contains 26 columns, which are split into key ENSO indicators and essential temporal/climate metrics:
ENSO Indicators:
- ONI: Oceanic Nino Index (measured in °C).
- SOI: Southern Oscillation Index.
- MEI.ext: Extended Multivariate ENSO Index.
- MEI.v2: Multivariate ENSO Index Version 2.
- OLR: Outgoing Longwave Radiation (W/m2).
- TNI OISST / TNI HadSST: Trans-Nino Indices.
- PNA: Pacific-North American Index.
- Nino 1+2 SST, Nino 3 SST, Nino 3.4 SST, Nino 4 SST: Sea Surface Temperature (°C) for four distinct Pacific regions.
- Nino 1+2 SST Anomalies, Nino 3 SST Anomalies, Nino 3.4 SST Anomalies, Nino 4 SST Anomalies: Sea Surface Temperature Anomalies (°C) for the four distinct regions.
Other Columns:
- Date, Month, Year: Temporal identifiers.
- Season (2-month), Season (3-month), Season (12-month): Various seasonal groupings.
- ENSO Phase-Intensity: Categorical description of the yearly ENSO phase (e.g., strong La Niña).
- Global Temperature Anomalies: Land and Ocean temperature anomalies (°C).
- Global Precipitation: Land and Ocean precipitation (mm).
Distribution
The data is typically structured as a single CSV file, approximately 109.47 kB in size. It contains 26 attributes (columns) and features up to 900 records, depending on the specific indicator. Note that certain metrics, particularly the Nino SST region data, OLR, Global Precipitation, and certain MEI indices, contain a notable number of missing values (ranging from 25% to 43% missing records).
Usage
Ideal applications for this dataset include:
- Climatic research focused on long-term ocean and atmospheric interaction.
- Developing and testing predictive models for El Niño and La Niña events.
- Analysis of global climate impacts, linking ENSO variability to temperature and precipitation patterns.
- Educational purposes in atmospheric science and earth systems courses.
Coverage
The data spans a significant period, providing standardised monthly climate metrics from 1950 through to 2024. Geographically, it covers the tropical eastern Pacific region crucial to ENSO development (Nino regions 1+2, 3, 3.4, and 4) and includes corresponding global temperature and precipitation anomaly data.
License
CC0: Public Domain
Who Can Use It
- Climate Scientists: For sophisticated analysis of long-term climate change drivers.
- Meteorologists and Weather Forecasters: For integrating interannual variability into prediction models.
- Academic Researchers: Studying oceanic and atmospheric teleconnections.
- Data Engineers: Building pipelines for climate monitoring dashboards.
Dataset Name Suggestions
- Global Monthly ENSO Index Dataset (1950–2024)
- Historical El Niño-Southern Oscillation Climate Metrics
- Standardised Interannual Climate Variability Data
- ENSO Indicator Suite
Attributes
Original Data Source:Standardised Interannual Climate Variability Data
Loading...
Free
Download Dataset in CSV Format
Recommended Datasets
Loading recommendations...