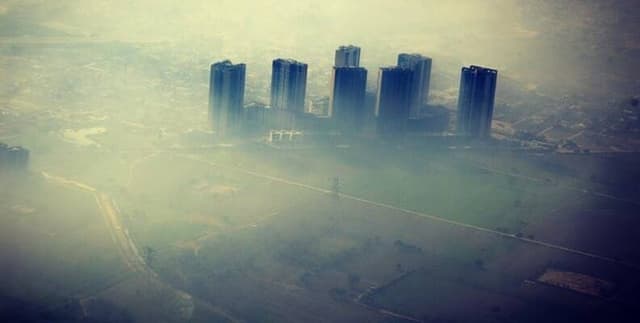
Most Polluted Cities Air Quality Data
Data Science and Analytics
Tags and Keywords
Trusted By


"No reviews yet"
Free
About
This dataset provides the IQAir index for the most polluted cities globally from 2017 to 2021. It offers insight into the contamination of air by substances harmful to human health, living beings, and the environment. Air pollution is a significant concern, contributing to diseases, allergies, and even fatalities in humans, as well as harming animals, food crops, and damaging the natural and built environments through issues like climate change and acid rain. The data reflects how both human activities and natural processes contribute to air pollution.
Columns
The dataset contains 19 columns, detailing various aspects of air quality:
- Rank: The ranking of the city based on its IQAir index, with values ranging from 1 to 6475.
- City: The name of the city. There are 6,216 unique city names present, with "Springfield, USA" being a most common example.
- 2021: The average IQAir index for the year 2021. Values range from 1.5 to 106, with a mean of 14.1.
- JAN(2021): The average IQAir index for January 2021.
- FEB(2021): The average IQAir index for February 2021.
- MAR(2021): The average IQAir index for March 2021.
- APR(2021): The average IQAir index for April 2021.
- MAY(2021): The average IQAir index for May 2021. Values range from 1 to 297, with a mean of 10.6.
- JUN(2021): The average IQAir index for June 2021.
- JUL(2021): The average IQAir index for July 2021.
- AUG(2021): The average IQAir index for August 2021.
- SEP(2021): The average IQAir index for September 2021.
- OCT(2021): The average IQAir index for October 2021.
- NOV(2021): The average IQAir index for November 2021.
- DEC(2021): The average IQAir index for December 2021.
- 2020: The average IQAir index for the year 2020.
- 2019: The average IQAir index for the year 2019.
- 2018: The average IQAir index for the year 2018.
- 2017: The average IQAir index for the year 2017. All values provided within the dataset are average readings.
Distribution
The dataset is provided as a CSV file, specifically "AIR QUALITY INDEX (by cities) - IQAir.csv", with a size of 603.43 kB. It comprises 19 columns and contains approximately 6,475 records, covering almost 6,000 of the most polluted cities.
Usage
This dataset is ideal for environmental research, public health studies, urban planning analysis, and policy development related to air quality. It can be used to identify trends in air pollution, benchmark city air quality, and understand the impact of various factors on atmospheric conditions. Users can leverage this data to inform strategies for pollution control and public health initiatives.
Coverage
The dataset's geographic scope includes nearly 6,000 of the most polluted cities worldwide. The time range spans five years, from 2017 to 2021, with detailed monthly average IQAir index values provided for the year 2021. No specific demographic scope is identified within the dataset.
License
CC0: Public Domain
Who Can Use It
This dataset is intended for a wide range of users, including:
- Environmental scientists and researchers studying air quality trends and the effects of pollution.
- Public health officials assessing health risks associated with air contamination.
- Urban planners designing sustainable cities and evaluating environmental impacts.
- Data scientists and analysts for predictive modelling and data visualisation related to air quality.
- Government agencies and policymakers for informed decision-making on environmental regulations.
Dataset Name Suggestions
- Global City Air Pollution: IQAir Index 2017-2021
- IQAir Global City Air Quality Data (2017-2021)
- Worldwide Urban Air Pollution Index
- Most Polluted Cities Air Quality Data
- Annual & Monthly City Air Pollution Averages (2017-2021)
Attributes
Original Data Source: Most Polluted Cities Air Quality Data
Loading...
Free
Download Dataset in ZIP Format
Recommended Datasets
Loading recommendations...
