Dark Mode

Monthly CO2 Trend Data from Hawaii Observatory
Data Science and Analytics
Tags and Keywords
Trusted By


"No reviews yet"
Free
About
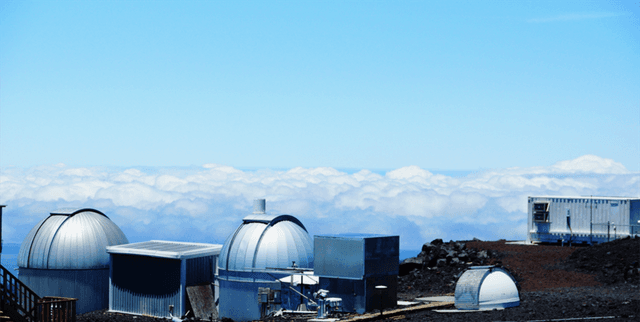
Monthly carbon dioxide observations are collected by the National Oceanic and Atmospheric Administration (NOAA) Global Monitoring Laboratory (GML) at the Mauna Loa Observatory (MLO) in Hawaii. This product details the average monthly carbon dioxide parts per million (PPM) recorded at the site. The Mauna Loa station is an essential atmospheric baseline station whose mission is to measure atmospheric constituents, such as carbon dioxide, that are known to drive changes in the Earth's climate. The data provides a long-term record for monitoring key atmospheric parameters since 1958.
Columns
The data file contains eight fields detailing the monthly measurements:
- year: The year when the observation was recorded (ranging from 1958 up to 2023).
- month: The specific month of the observation (ranging from 1 to 12).
- decimal date: The year and month expressed in decimal form.
- average: The average CO2 level observed, measured in PPM (ranging from approximately 312 to 424).
- deseasonalized: The deseasonalized CO2 value.
- ndays: The number of days included in the observation period for that month.
- sdev: The standard deviation of the observations.
- unc: The uncertainty associated with the measurement.
Distribution
The data file is usually provided in a CSV format, presented as a tabular structure. It contains 790 valid records. The expected frequency for updates to this data product is monthly.
Usage
This information is highly valuable for applications related to global climate stability, including:
- Tracking long-term trends in atmospheric CO2 concentrations.
- Supporting long-term tropospheric measurements of key atmospheric parameters.
- Input for Earth Science research and modelling.
- Data Visualisation projects focused on environmental change.
Coverage
The geographic scope is the Mauna Loa Observatory located in Hawaii, United States. The time coverage begins in 1958 and continues, with current records extending up to 2023. The data is updated monthly.
License
CC0: Public Domain
Who Can Use It
- Researchers: For analysis involving long-term atmospheric baselines and climate forcing constituents.
- Data Visualizers: To create charts and reports illustrating the increase in carbon dioxide over time.
- Students: Ideal for projects in Earth Science and time-series analysis.
- Government Agencies: For monitoring global warming metrics and associated business implications.
Dataset Name Suggestions
- NOAA Monthly CO2 PPM
- Mauna Loa Monthly CO2 Observations
- Global Baseline Atmospheric CO2 Measurements
Attributes
Original Data Source: Monthly CO2 Trend Data from Hawaii Observatory
Loading...
Free
Download Dataset in CSV Format
Recommended Datasets
Loading recommendations...