Dark Mode

Earth Surface Temperature Anomalies Dataset
Data Science and Analytics
Tags and Keywords
Trusted By


"No reviews yet"
Free
About
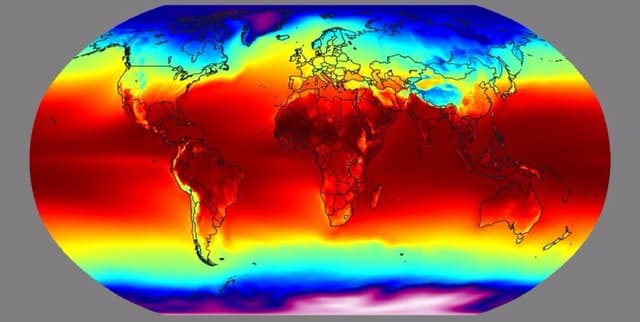
This dataset presents high-resolution global monthly averages of Earth's surface temperature from 1850 to 2022. It is a preliminary data product, an expansion of the previous Berkeley Earth temperature dataset, incorporating predictive structures based on historical weather patterns. The underlying resolution is increased to 0.25° x 0.25° latitude-longitude. The file details changes in Earth's global average surface temperature by combining the new high-resolution Berkeley Earth land-surface temperature field with a reinterpolated version of the HadSST4 ocean temperature field. It merges land-surface air temperatures with ocean sea surface water temperatures. In sea ice regions, where air temperatures above sea ice can differ substantially from the water below, temperature anomalies are extrapolated from land-surface air temperatures when ice is present and from ocean temperatures when ice is absent. Sea ice coverage, taken from the HadISST v2 dataset, typically varies between 3.5% and 5.5% of the Earth's surface monthly. Temperatures are reported in Celsius as anomalies relative to the January 1951-December 1980 average, with uncertainties representing a 95% confidence interval for statistical and spatial undersampling effects and ocean biases. The estimated January 1951-December 1980 global mean temperature is 14.148 +/- 0.019 °C. The dataset also includes monthly absolute temperatures for the same reference period, acknowledging the mean seasonality due to Earth's asymmetrical land distribution. For each month, the dataset provides the estimated global surface temperature anomaly and its uncertainty, alongside corresponding values for 12-month, five-year, ten-year, and twenty-year moving averages.
Columns
- Year: The year of the observation, ranging from 1850 to 2023.
- Month: The month of the observation, ranging from 1 to 12.
- Monthly Anomaly: The estimated global surface temperature anomaly for the given month, reported in Celsius relative to the January 1951-December 1980 average. Values typically range from -0.97 to 1.5.
- Monthly Unc.: The uncertainty associated with the monthly temperature anomaly, representing a 95% confidence interval. Values typically range from 0.03 to 0.93.
- Annual Anomaly: The 12-month moving average of the temperature anomaly, centred about the reported month. Values typically range from -0.56 to 1.18.
- Annual Unc: The uncertainty associated with the annual temperature anomaly. Values typically range from 0.02 to 0.38.
- Five-Year Anomaly: The five-year moving average of the temperature anomaly, centred about the reported month. Values typically range from -0.43 to 1.05.
- Five-Year Unc.: The uncertainty associated with the five-year temperature anomaly. Values typically range from 0.02 to 0.2.
- Ten-Year Anomaly: The ten-year moving average of the temperature anomaly, centred about the reported month. Values typically range from -0.4 to 0.96.
- Ten-Year Unc.: The uncertainty associated with the ten-year temperature anomaly. Values typically range from 0.01 to 0.14.
- Twenty-Year Anomaly: The twenty-year moving average of the temperature anomaly, centred about the reported month. Values typically range from -0.32 to 0.84.
- Twenty-Year Unc.: The uncertainty associated with the twenty-year temperature anomaly. Values typically range from 0.01 to 0.11.
Distribution
The dataset is provided as a CSV file named "Global Temperature.csv", with a size of approximately 144.88 kB. It contains 12 columns and features over 2000 rows of monthly data points, covering the period from 1850 to 2022.
Usage
This dataset is ideal for:
- Analysing historical global temperature trends.
- Studying the impacts of climate change and global warming.
- Supporting environmental research and policy development.
- Developing predictive models for future climate scenarios.
- Educational purposes in climate science and earth studies.
- Investigating long-term weather patterns and their anomalies.
Coverage
The dataset provides global coverage, focusing on Earth's surface temperature. It spans a time range from January 1850 to December 2022. The data is presented at a high resolution of 0.25° x 0.25° latitude-longitude. It combines land-surface air temperatures and ocean sea surface water temperatures. Specific notes on data availability include the methodology for sea ice regions, where temperature anomalies are extrapolated from land or ocean temperatures depending on the presence of ice, based on HadISST v2 dataset varying monthly and by location.
License
Attribution-NonCommercial 4.0 International (CC BY-NC 4.0)
Who Can Use It
- Climate Scientists and Researchers: For detailed climate modelling, trend analysis, and academic studies on global warming.
- Environmental Agencies and Policymakers: To inform environmental impact assessments, develop climate action plans, and monitor global temperature changes.
- Educators and Students: As a valuable resource for teaching and learning about Earth's climate history and current environmental challenges.
- Data Analysts and Statisticians: For in-depth statistical analysis and visualisation of long-term temperature data.
- Public and NGOs: To raise awareness and support advocacy related to climate change.
Dataset Name Suggestions
- Global Earth Temperature Averages (1850-2022)
- High-Resolution Historical Global Temperature Data
- Berkeley Earth Global Climate Record
- Earth Surface Temperature Anomalies Dataset
- Monthly Global Temperature Trends (1850-2022)
Attributes
Original Data Source:Earth Surface Temperature Anomalies Dataset
Loading...
Free
Download Dataset in ZIP Format
Recommended Datasets
Loading recommendations...