Dark Mode

Historical US Food Price Index and Economic Trend Database
Food & Beverage Consumption
Tags and Keywords
Trusted By


"No reviews yet"
Free
About
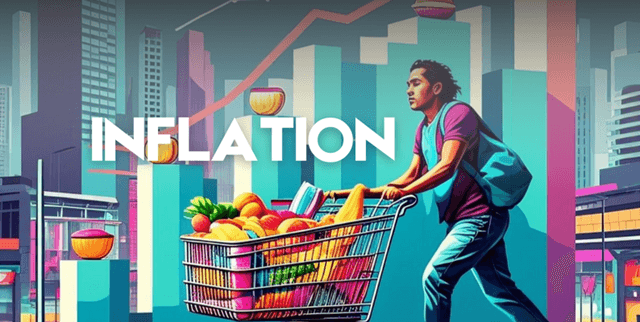
Analysing Producer Price Index (PPI) trends for food items in the United States provides critical insights into economic shifts and market dynamics. By tracking price changes from 2002 to 2023, these records offer a foundation for examining inflation and its impact on purchasing power. The collection includes detailed forecasts and percentage changes, enabling a thorough exploration of how costs for specific categories, such as wholesale beef, fluctuate over time. This resource serves as a vital tool for economic research and financial forecasting by quantifying the average change in prices paid by consumers for essential goods.
Columns
- producer_price_index_item: Specifies the particular category of food item for which the PPI is recorded, such as wholesale beef or other commodities.
- month_of_forecast: Indicates the specific month in which the price prediction or forecast was generated.
- year_of_forecast: The calendar year in which the forecast was made, covering the period from 2002 to 2023.
- year_being_forecast: The target year to which the PPI forecast applies, providing data points up to 2024.
- attribute: Details the type of prediction data provided, such as the mid-point, lower bound, or upper bound of a confidence interval.
- forecast_percent_change: The predicted percentage shift in the Producer Price Index for the specified food item.
Distribution
The information is delivered in a CSV file titled
ppi_dataset.csv with a file size of 1.49 MB. It contains 19,800 valid records with a 100% validity rate across all columns, ensuring no missing or mismatched entries. The dataset maintains a high usability score of 10.00 and is designed for annual updates to reflect the latest economic trends.Usage
This resource is ideal for performing longitudinal inflation analysis and market trend evaluations within the US food sector. It is well-suited for training predictive models in financial forecasting and for academic research into purchasing power. Researchers can also utilise the data to compare historical price forecasts against actual market outcomes to assess the accuracy of economic indicators over two decades.
Coverage
The geographic scope is focused on the United States of America. Temporally, the data captures a broad range of forecasts issued between 2002 and 2023, with applicability extending into 2024. The demographic relevance spans the general consumer market as it reflects the pricing shifts for a diverse array of 13 unique food item categories.
License
CC0: Public Domain
Who Can Use It
Economic researchers can leverage these records to identify long-term patterns in food inflation and price stability. Financial analysts may use the forecasted percentage changes to inform risk assessments and investment strategies in the agricultural market. Additionally, data scientists and students can employ the structured time-series format to practice statistical modelling and regression analysis on real-world economic indicators.
Dataset Name Suggestions
- US Food Item Producer Price Index: 2002–2023 Inflation Archive
- United States Food Market PPI and Inflation Forecast Registry
- Historical US Food Price Index and Economic Trend Database
- Longitudinal Food Item PPI and Forecast Percentage Change Set
- USA Food Commodity Inflation and Price Index Analysis
Attributes
Original Data Source: Historical US Food Price Index and Economic Trend Database
Loading...
Free
Download Dataset in CSV Format
Recommended Datasets
Loading recommendations...