Dark Mode

US Congressional Stock Transactions Data
Stock & Market Data
Tags and Keywords
Trusted By


"No reviews yet"
Free
About
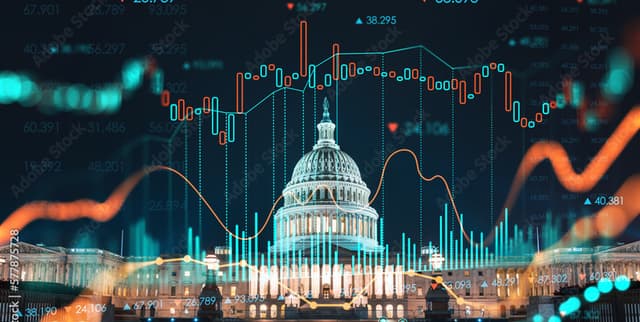
Provides a detailed analysis of stock transactions made by American lawmakers, offering insight into their investment activities and financial disclosures. It is designed to assist in decoding the asset selections and transaction patterns of members of the US Congress. The information captures key details about financial movements, including transaction types, amounts, and associated industries.
Columns
The dataset contains 16 columns of crucial transaction data:
- disclosure_year: The year when the financial disclosure was formally made.
- disclosure_date: The specific date the financial disclosure occurred.
- transaction_date: The actual date the stock transaction took place.
- owner: Specifies the ownership of the asset, such as "joint" or "self."
- ticker: The unique ticker symbol corresponding to the asset.
- asset_description: A textual description of the asset involved.
- type: Categorisation of the transaction, such as "purchase" or "sale_full."
- amount: The range representing the transaction value (e.g., "$1,001 - $15,000").
- representative: The full name of the representative connected to the transaction.
- district: The political district represented by the lawmaker.
- state: The state represented by the lawmaker.
- ptr_link: A direct link to the public disclosure record for the transaction.
- cap_gains_over_200_usd: A Boolean indicator showing if capital gains exceeding $200 USD were realised.
- industry: The specific industry associated with the asset.
- sector: The broader economic sector of the asset.
- party: The political affiliation of the representative.
Distribution
The raw data file is typically supplied in CSV format and is approximately 4.07 MB in size. It holds over 17,200 records detailing the various financial movements. This dataset has a recorded usability rating of 10.00.
Usage
This data is highly valuable for conducting financial analysis, especially concerning investment patterns linked to political decision-makers. It is ideal for researchers studying government oversight, ethical conduct in public office, and correlation studies between political actions and market performance.
Coverage
The focus is strictly on stock transactions involving US representatives. The time scope runs from 2nd January 2020 through to 14th May 2023. This captures recent financial activities across multiple disclosure and transaction dates. The data provides specific geographical coverage via the representatives' state and district details.
License
CC0: Public Domain.
Who Can Use It
Financial journalists requiring evidence-based reporting; investors seeking insights into market trends observed by political insiders; academic researchers focusing on legislative finance and accountability.
Dataset Name Suggestions
- US Congressional Stock Transactions Data
- Lawmaker Investment Activities
- Decoding US Congressional Stock Picks
Attributes
Original Data Source: US Congressional Stock Transactions Data
Loading...