Dark Mode

Global WASH Access and Mortality Rates
Public Safety & Security
Tags and Keywords
Trusted By


"No reviews yet"
Free
About
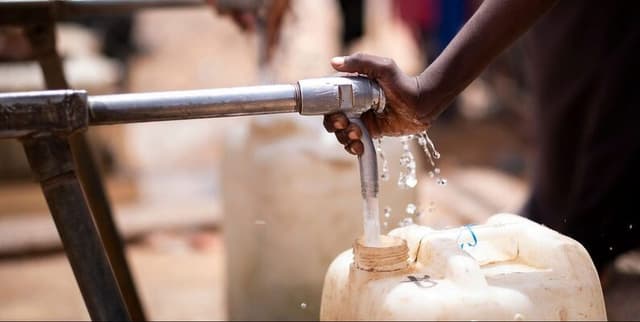
Explore global statistical data detailing access to water, sanitation, and hygiene (WASH). The data focuses on death rates from unsafe water sources, which provide an accurate method for comparing mortality impacts between countries and tracking changes over time. Death rates are measured as the number of deaths per 100,000 people. Significant disparities are evident: rates across lower-income economies, particularly in Sub-Saharan Africa and Asia, are often greater than 50 per 100,000 people. This contrasts sharply with high-income countries, such as those in Europe, where rates are often below 0.1 per 100,000, illustrating a difference greater than 1000-fold. This confirms that issues related to unsafe water sources are primarily limited to low and lower-middle-income countries, demonstrating a strong negative relationship between national wealth and death rates. The dataset also helps monitor progress toward Sustainable Development Goal (SDG) Target 6.1, which aims to achieve universal and equitable access to safe and affordable drinking water for all by 2030. Progress has been slow since 2015, risking failure to meet the 2030 target.
Columns
- Country: Identifies the specific country or region. This column has 254 unique geographical entries and is 100% valid.
- Year: Specifies the year the data was recorded, ranging from 2000 to 2022. This column is 100% valid.
- Usage of safely managed drinking water services: Represents the percentage of the population that uses safely managed drinking water services.
Distribution
The data is delivered in a CSV file format. The file contains 5737 records covering the period from 2000 through 2022. While the Country and Year fields are fully populated, the primary metric, Usage of safely managed drinking water services, has a substantial portion of missing data: 1953 records (34%) are missing values, leaving 3784 valid records (66%).
Usage
This dataset is suitable for:
- Policy Evaluation: Assessing the effectiveness of global interventions aimed at improving water safety and reaching SDG 6.1.
- Development Research: Analysing the strong correlation between national income, access to safe water, and public health outcomes.
- Risk Identification: Pinpointing regions, especially in Sub-Saharan Africa and Asia, where death rates from unsafe water are highest.
- Inequality Studies: Demonstrating the over 1000-fold difference in mortality rates between high-income and low-income nations.
Coverage
The geographical scope is global, encompassing 254 unique countries and territories. The temporal scope spans 23 years, from 2000 up to 2022. Demographically, the data covers the world's population, highlighting that in countries with the lowest incomes, less than one-third of the population uses safely managed water, concentrating the deficit in regions like Sub-Saharan Africa.
License
CC0: Public Domain
Who Can Use It
- International Non-Governmental Organisations: To target funding and resource allocation toward low and lower-middle-income countries where the health burden is greatest.
- Academic Researchers: For statistical modelling and analysis of global health indicators and environmental factors.
- Public Health Agencies: To monitor long-term trends in water access and mortality, specifically noting where progress is too slow to meet 2030 targets.
- Data Journalists: To illustrate global inequality based on stark mortality differences.
Dataset Name Suggestions
- Global WASH Access and Mortality Rates
- SDG 6.1 Drinking Water Tracker (2000-2022)
- Unsafe Water Death Rates by Country and Income
Attributes
Original Data Source: Global WASH Access and Mortality Rates
Loading...
Free
Download Dataset in CSV Format
Recommended Datasets
Loading recommendations...