Dark Mode

WHO and JHU Comparative COVID-19 Case Analysis
Patient Health Records & Digital Health
Tags and Keywords
Trusted By


"No reviews yet"
Free
About
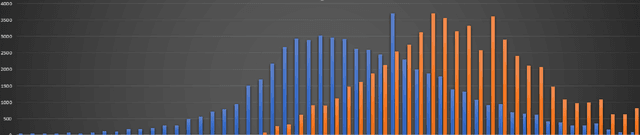
Analysing the temporal gap between the initial appearance of symptoms and official medical diagnosis is crucial for identifying the actual trajectory of a viral outbreak. By comparing these two distinct timelines, researchers can account for the inherent lag in reporting, providing a clearer picture of infection rates during the early stages of a global health emergency. This resource integrates figures from prominent health organisations and academic institutions to offer a multi-faceted view of case trends in both China and Italy during the opening months of 2020.
Columns
- Date: The calendar date of the record, spanning from the start of January to early April 2020.
- CN_Diag_WOM: Daily diagnosed case numbers for China as reported by Worldometers.
- CN_Diag_CSSE: Daily diagnosed case numbers for China sourced from the Johns Hopkins University Center for Systems Science and Engineering.
- CN_Onset_WHO: Estimated daily counts of individuals first experiencing symptoms in China, derived from World Health Organisation visual data.
- CN_Diag_WHO: Daily diagnosed cases in China estimated from reports published by the World Health Organisation.
- IT_Diag: Daily diagnosed case figures for Italy, capturing the onset of the outbreak within the European region.
Distribution
The data is delivered in a CSV format titled
dataset.csv with a file size of 2.68 kB. It contains 99 valid records organised across 6 columns, maintaining a 100% validity rate with no missing or mismatched values. The resource holds a usability score of 10.00 and is configured for daily updates.Usage
This collection is primarily designed for epidemiological modelling and forecasting the spread of infectious diseases. It allows for the development of mathematical models that explain the relationship between symptom onset and official diagnosis. Analysts can use these figures to estimate actual infection rates in other regions by applying the lag-time patterns observed in the Chinese and Italian data. It is also suitable for academic research into the accuracy of early pandemic reporting across different data aggregators.
Coverage
The geographic scope is focused on China and Italy, representing the earliest major epicentres of the pandemic. Temporally, the records span from 1 January 2020 to 8 April 2020. Data availability varies by category, with symptom onset figures covering the initial surge in China (January to February), while diagnosed cases for both nations extend through to the spring.
License
Attribution 4.0 International (CC BY 4.0)
Who Can Use It
Epidemiologists and public health researchers can leverage these figures to refine their understanding of viral transmission windows and reporting delays. Data scientists can utilise the time-series information to build and validate predictive models for disease progression. Additionally, health policy advisors can use the lag-time analysis to better prepare for diagnostic demand and hospital resource allocation during subsequent outbreaks.
Dataset Name Suggestions
- Early COVID-19 Symptom Onset vs Diagnosis Time-Series
- China and Italy Viral Infection Lag-Time Registry
- WHO and JHU Comparative COVID-19 Case Analysis
- Predictive Modelling Data for COVID-19 Onset Trends
- International COVID-19 Diagnosis and Symptom Onset Index
Attributes
Original Data Source: WHO and JHU Comparative COVID-19 Case Analysis
Loading...
Free
Download Dataset in CSV Format
Recommended Datasets
Loading recommendations...